Introduction
Release notes are usually written for the person pressing the buttons. This month I want to write them for the person who owns the budget, because the October 2026 release has a clear through-line: it shortens the distance between a budget question and a defensible answer.
Think about the questions that actually land in a planning meeting. Can we trust the data the model was fed? Are we optimizing for the right thing? Do the scenarios start from reality or from hand-typed numbers? And can somebody just ask, in plain language, instead of filing a ticket?
This release moves on all four, with a pile of modeling and usability work underneath. Here’s the tour.
Can we trust the data going in?
Every argument I have ever seen about a model’s output eventually walks upstream and turns into an argument about the data. A gap in the spend series. A price jump that looks like a demand shock. A variable that went flat for six months because a feed broke. None of that arrives in the coefficients with a label on it. It arrives as a funny number in a board deck.
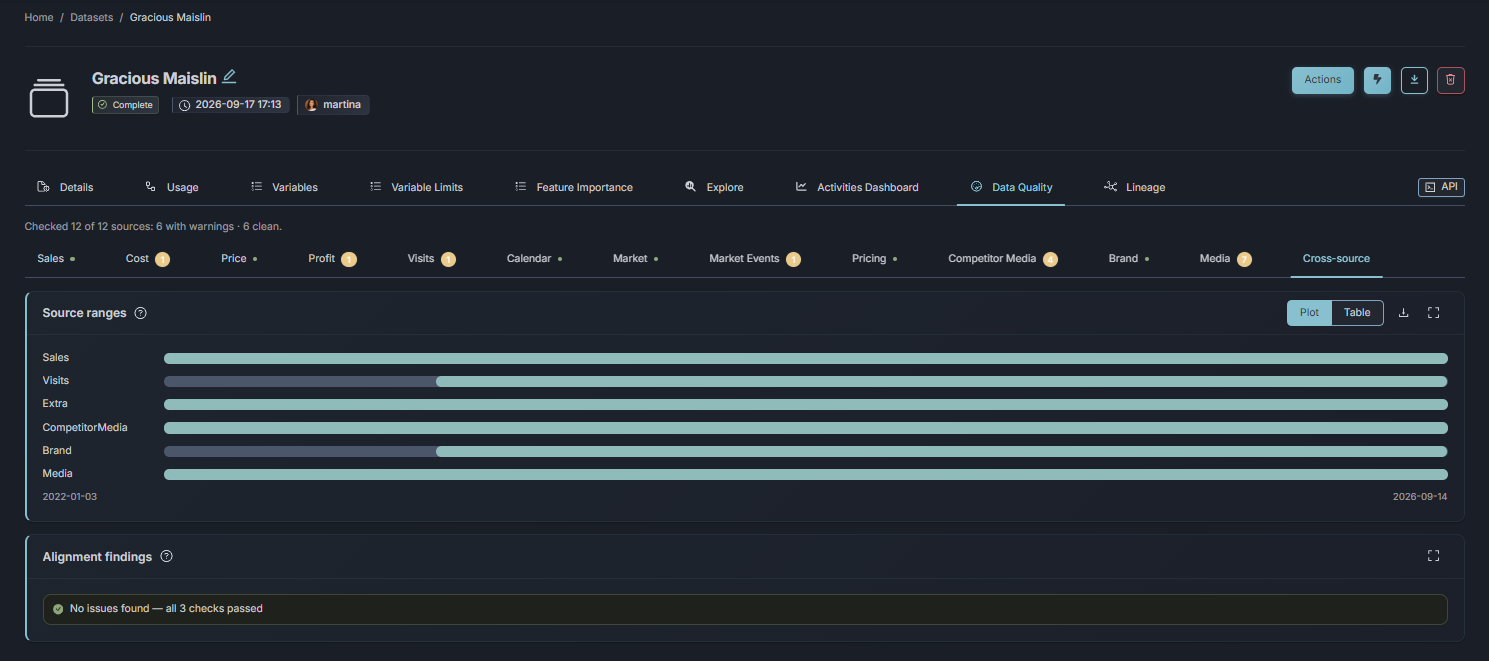
Datasets now get a quality report that gives an overview and flags potential data quality and consistency issues: gaps, outliers, correlations, statistics. And when something looks off, you can inspect and validate it on the spot, before anyone models it.
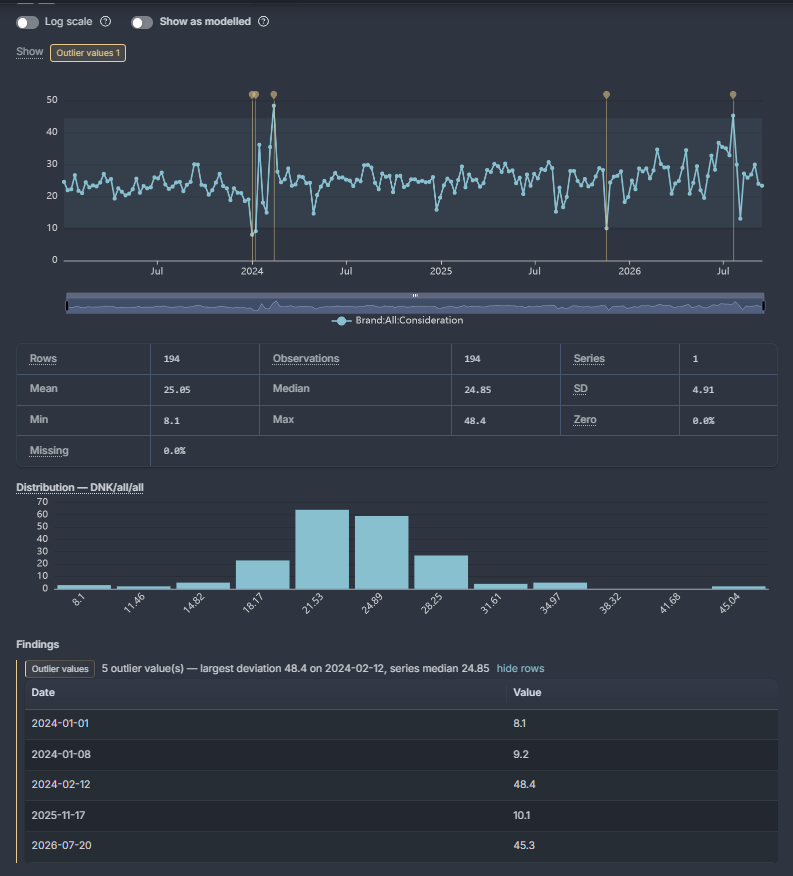
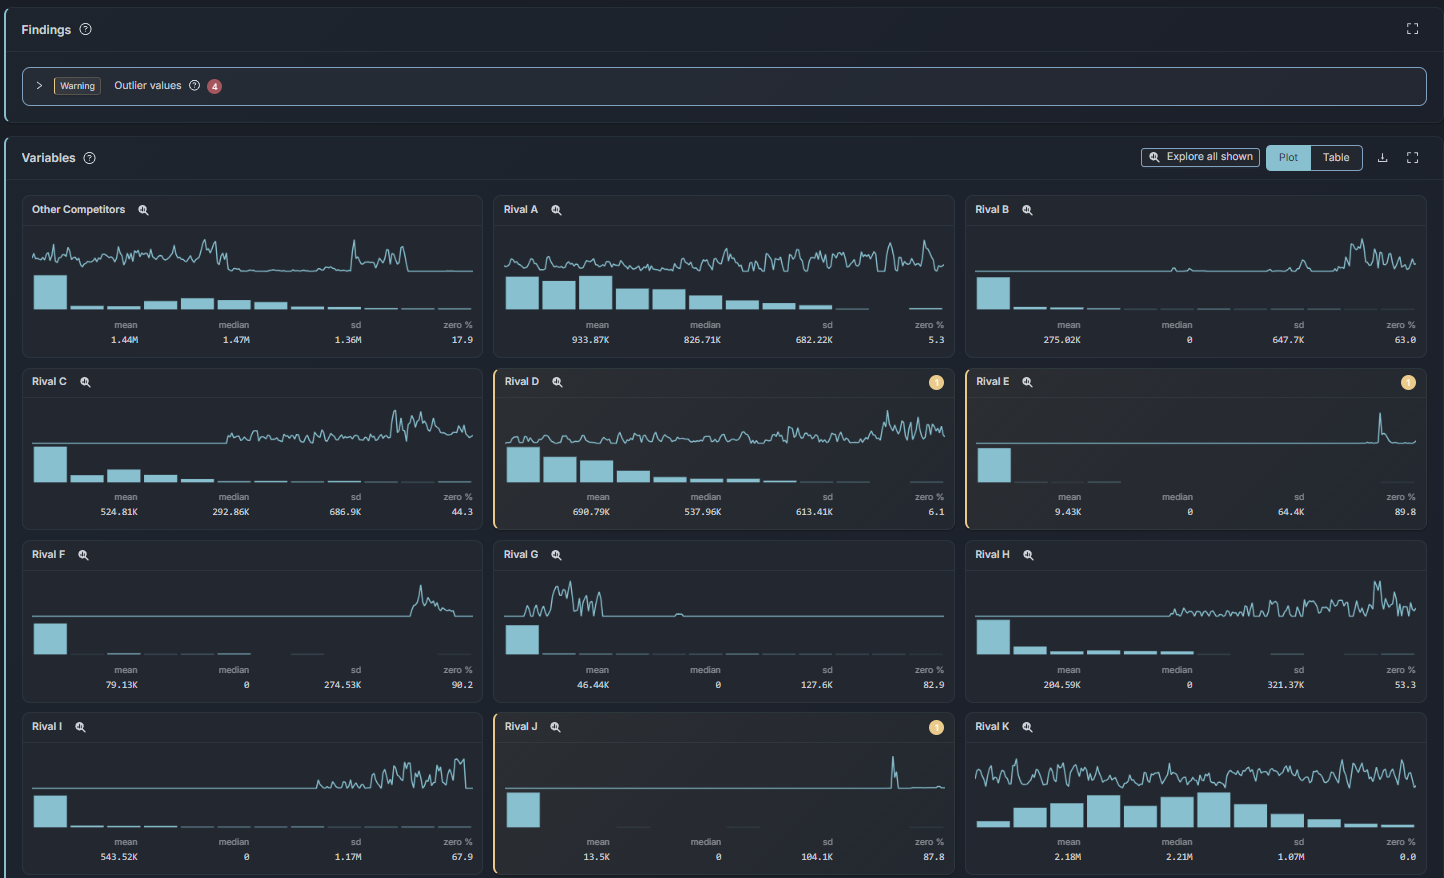
Two supporting changes make the data work calmer. Datasets have a global date range now, so the modeling window is set once, in one place, and changing it stops being an evening of pre-subsetting every input file before upload. And the Explorer gained a lineage tab (what depends on what), an interpolation lab, and a raw-versus-interpolated view, so you can always see which part of the story is measured and which part is filled in. That distinction is worth having in a room where numbers get challenged.
Profit-targeted optimization
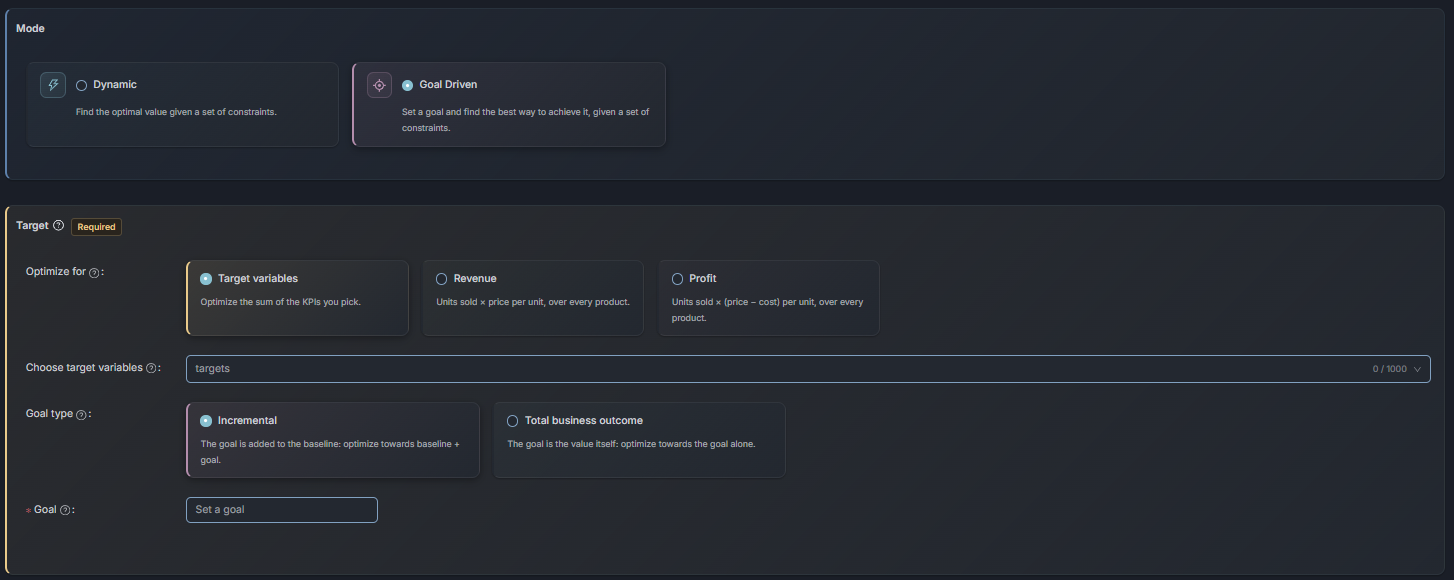
Optimizations can now target profit as well as revenue, and this is the item I would point a performance director at first. You choose whether the target counts the pre and post periods, and results come in two views, Incremental and Total.
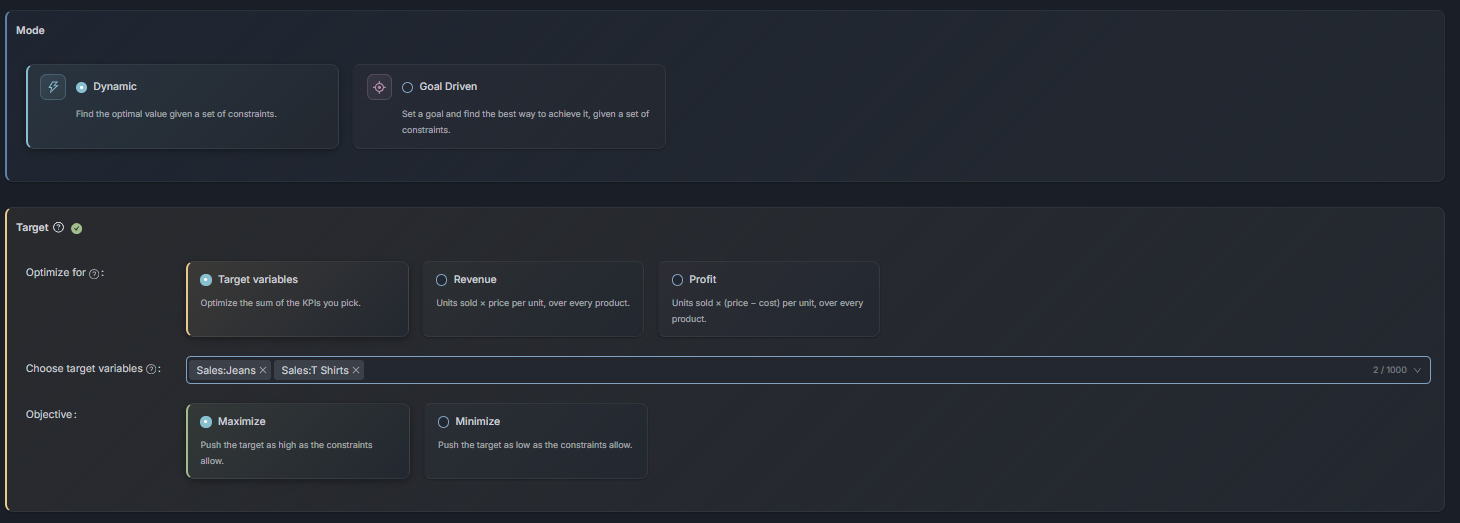
Why does the target matter so much? Because a plan that maximizes revenue can quietly buy growth that costs more than it earns. Push spend into a channel until the last euro returns a euro of revenue, and the P&L can still come out worse. A profit target forces the model to respect unit economics, so the recommended plan defends itself in front of a CFO, and the Incremental and Total views make clear what the plan adds versus what it moves around.
Reference periods: scenarios that start from reality
The quiet star of this release, if you ask me. Optimizations, predictions and simulations can now pre-fill their values from a reference period. You pick a historical period that fits the question, the actual values from that period become the foundation of the scenario, you modify the ones you want to change, and the optimizer optimizes the rest.
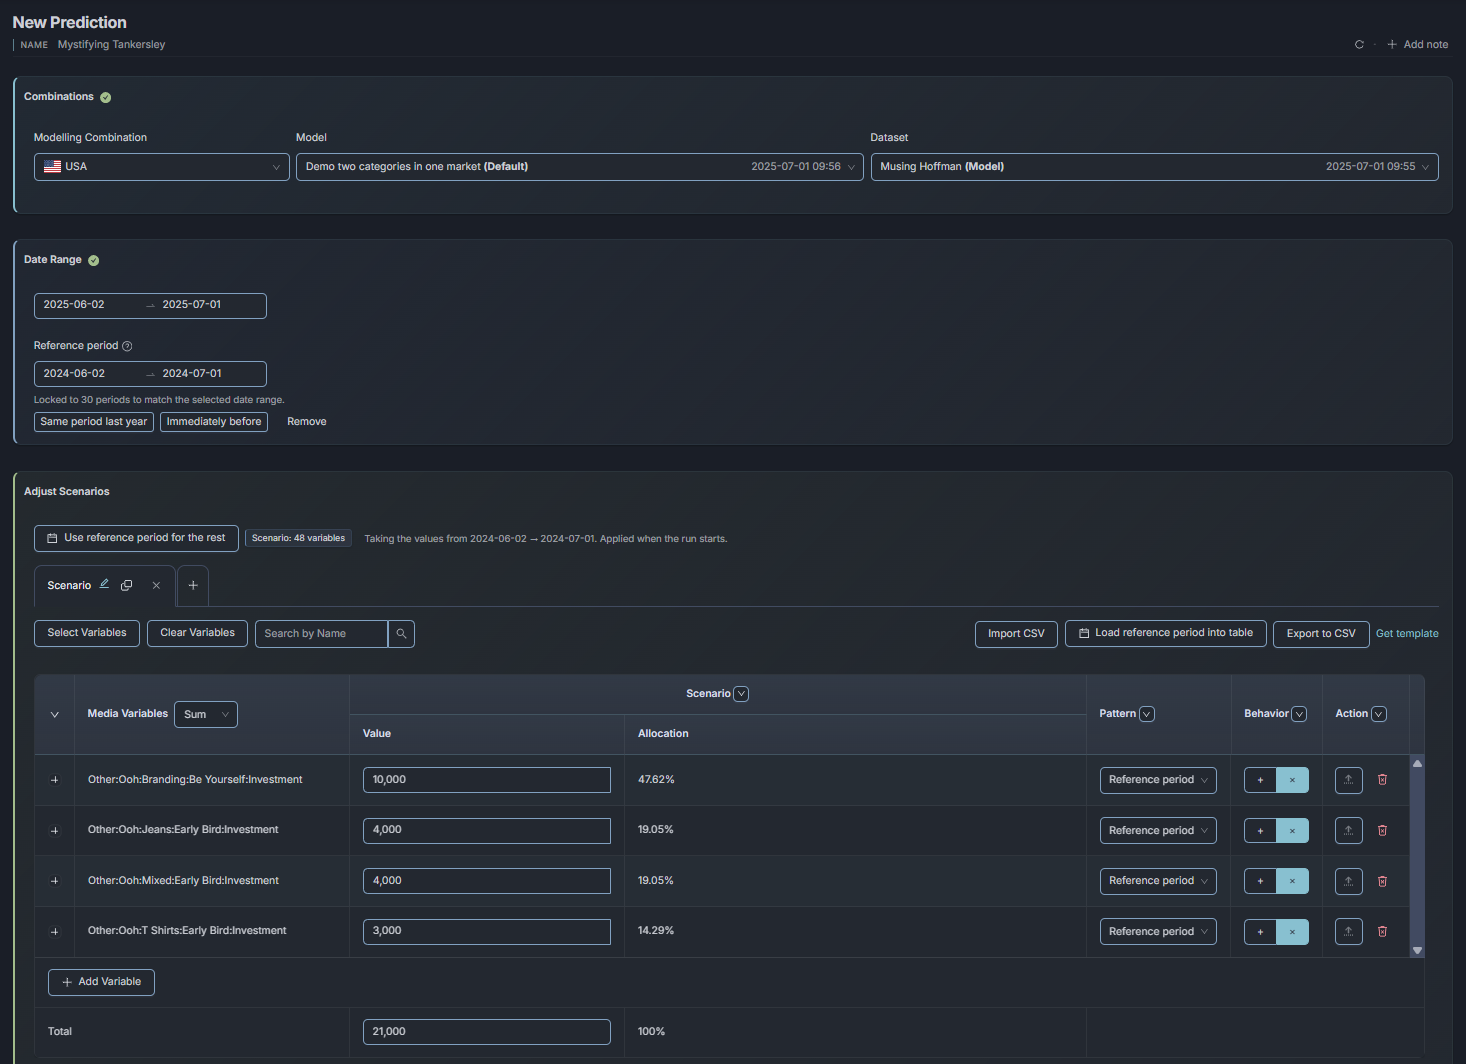
Why is this a big deal? Because every what-if conversation used to start with somebody typing a baseline by hand. Which numbers, from which week, in whose version? The scenario took an hour to set up and carried transcription risk the whole way through. Now “what if we ran October again with 20% less paid social” is a two-minute exercise anchored in what October actually was. The argument moves to the decision at hand, with the baseline settled before the meeting starts.
MCP access: bring your own AI
The October release ships the platform’s MCP layer. MCP (Model Context Protocol) is the open protocol that AI assistants and agents speak. With it enabled, the assistant your team already uses, whichever one that is, can operate Alviss directly: create and refit models, run simulations, optimizations, response curves, attributions and backtests, compare models and rank results. Every answer links to the matching page in the app, so a human can check the working rather than take the agent’s word for it.
Why expose the platform this way? Because the assistant your team already trusts, with your prompts and your context, is the one that will actually get used. Our job is to expose the platform properly, and your AI does the talking.
Two details worth pausing on. Job lists show whether a job was started in the app or through the MCP, so there is an audit trail. And the layer surfaces warnings about dropped rows, holdout periods and missed goals instead of silently returning wrong numbers. Tooling that admits when it couldn’t do the job cleanly is worth more than tooling that always sounds confident.
One more thing, and it matters: MCP access ships to a selected group of customers for now, and access needs to be requested. If your team is already running agents and wants them to operate the measurement stack, that conversation is easy to start.
Response curves with their uncertainty attached
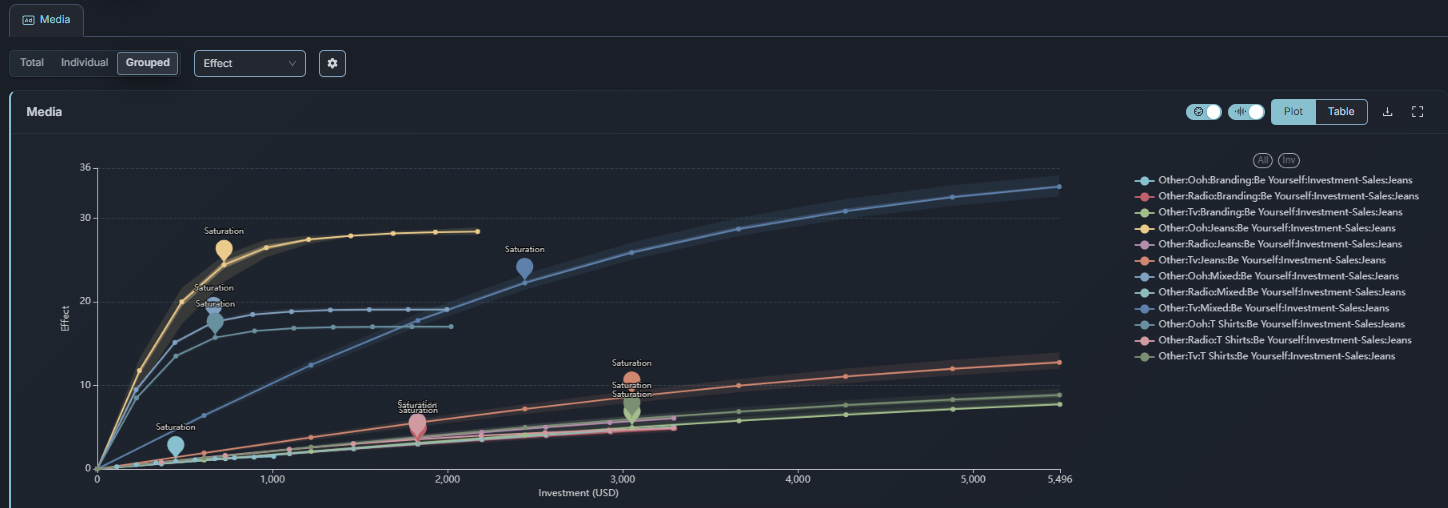
Performance marketing lives on one question: when does this channel stop paying? Response curve insights now include the marginal return, the saturation point and an uncertainty band, and they are consistent between the app and the MCP, so you get the same numbers whether you look or ask.
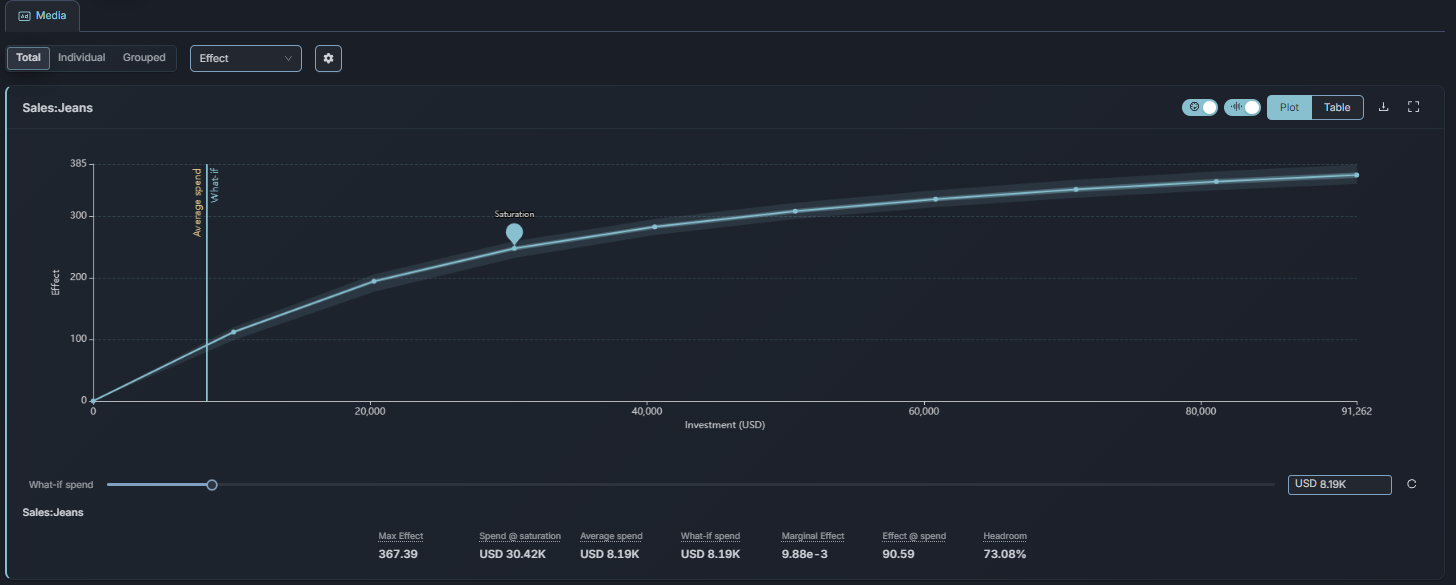
The uncertainty band is the part I care about. A saturation point at 1.2 million per month means one thing if the band around it is tight and something completely different if it is wide. Decisions deserve uncertainty estimates, and now the curve carries its own.
Modeling, made clearer
A cluster of modeling improvements rounds out the release. The graph layout was redesigned, and the model graph builder now saves, names and reopens graphs, with a dry run that tests the whole structure before training. You find out the graph is wrong in seconds, rather than after a training run.
The model detail page was redesigned as well, around a clear verdict, a visible status and grouped tabs. When you share a model with stakeholders, the first thing they see is what the model concluded and whether it is healthy, with the details filed where people can actually find them. And there was a general polish pass across the app: look, accessibility, keyboard support. Unglamorous, and it adds up.
Activities dashboard
Two smaller items worth a line. Events now shows a days-active heatmap in place of the old over-time chart, which is a much better answer to “when were we actually active”. And Activities and Attribution got a Mean/Sum switch on the Extra tab, so you can read extras as an average or a total, depending on the question.
Conclusion
The through-line of this release is the through-line of the product: a shorter distance between question and defensible answer. Data quality visible before modeling, one global date range instead of file-by-file subsetting, optimization that can target profit, scenarios grounded in a real reference period, response curves that carry their own uncertainty, and, for a selected group of customers, your own AI operating the stack through the MCP.
If you are a customer, it is live now, and the natural first stop is the quality report on the dataset you trust least. If the MCP is the interesting part, request access; that is the door to knock on. And if you are weighing platforms and this is how you think measurement should work, we are easy to find.